According to Gregory Kramer, founder of ICAD, sonification is an effective instrument for presenting data in the form of non-linguistic sound events and has the potential to enable a hitherto unattained access to highly complex, multidimensional, scientific information. It is a young discipline that up to now has been struggling with considerable difficulties regarding its legitimacy and serious problems connected with the theory of knowledge. Sonification methods, which are referred to as the acoustic counterpart to visual representation, are perceived by science subjectively. Where does this mistrust come from? What has been researched to date? Are there basic limits to the auditory production of knowledge? Does the acoustic turn have a right to exist alongside the pictorial turn? What are its strengths and weaknesses? The objective of this paper is to examine sonification as a method of cognition and as a presentation medium, in order to review their use in design.
In this connection, alongside a brief insight into its history, a number of observations are made in the first part regarding the current status of interdisciplinary acoustic research, and the second part explicitly deals with sonification in science. In doing so, different areas of application and techniques are presented. The sense of hearing is also examined as a cognitive tool and as an analogy to visual representation. Why is the use of our hearing relevant? How can visual methods be applied to sonification? After presenting application examples and methods of auditory displays that describe how data can be depicted acoustically, answers to the previously posed questions are formulated in the third part using a practical case as an example. After evaluation of the thesis, the final part concludes with a summary as well as some thoughts and ideas about possible future perspectives.


Excerpt of the experiment
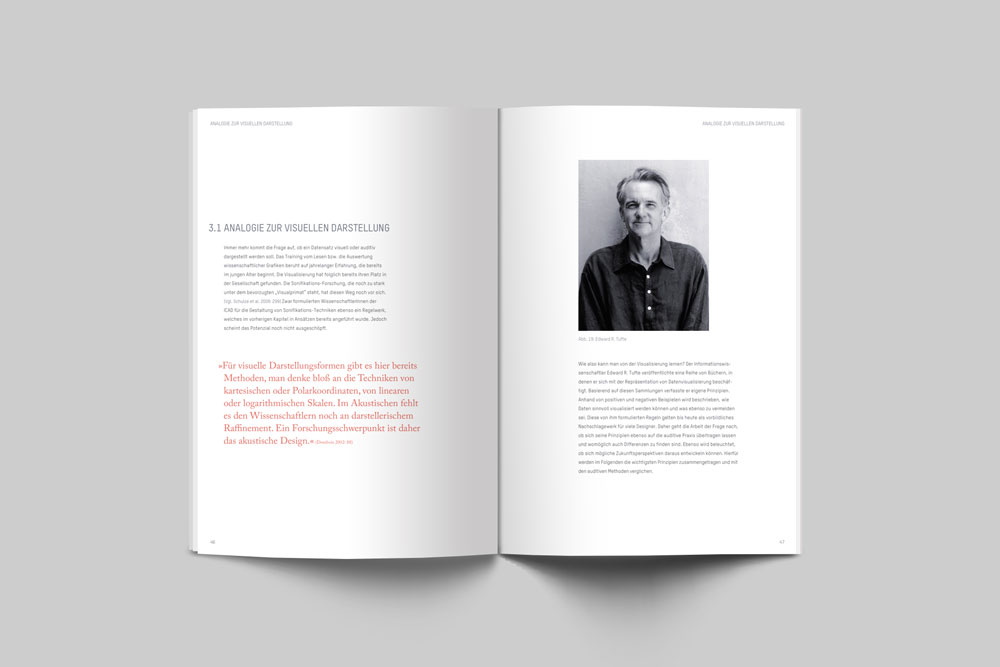
Based on the »Principles of Graphical Excellence« by information scientist Edward Tufte the work explores the question of whether its rules can also be applied to auditory practice. Therefore I analyzed and sonified a selection of his graphics which are documented as sound and video files. (Picture Credits: The Visual Display of Quantitative Information, Tufte, Edward Rolf, 2001)
1. Sonification of Infographic: Traffic Deaths.
»Graphics must not quote data out of context.« (Tufte 2001: 77)
The question arises how this course into the auditory procedures can be translated and how this information sound. For this, the respective points were determined from the graphic and in broadcast the score of a sequencer – in this case Ableton Live. For this it is important to first translate the values of the y and x axes. A tone is assigned to each of the numerical units. For that have to the distances are determined in each case. The number of fatal traffic accidents is transmitted in tones of the y-axis and the year of the x-axis in Seconds. Every year corresponds to a second interval in the program. In order to present the tones as clearly and comfortably as possible, they were placed in the middle of the range. If they are too high, they will unbearable for the hearing, they are too deep, they lose volume and Brilliance. However, since the graphic not only represents points, but also one over time in the form of a curve, it must therefore also be included in the auditory representation. So the points connected with a pitch envelope. A comparison to other parameters can be useful. The crucial question is how sounds work for each curves and points are created. Particular attention must be paid to ensure that each event is well perceived and also separated is recognized from each other.

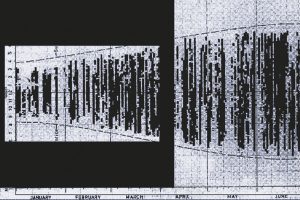
2. Sonification of Infographic: Annual Sunshine Report.
»Maximize data density and the size of the matrix within reason.« (Tufte 2001: 175)
Edward Tufte describes that a person’s eyes are remarkable in recognizing differences within a small area.
He wonders how much information can really be shown and recognize in a small space. It is interesting for sonication to find out how much information can also be heard at once and be efficiently recognizable.
»We can easily pick particular sounds out of a noisy background while it is easy to overlook details in visual displays.« (Kramer 1992: 566)
The times are shown within a year when the sun is shining. y-axis describes the time in the form of a whole day in the 24-hour window from 12 midnight to next midnight. The months are on the x-axis the whole year. Overall result from the Sun rays 160 numbers per square centimeter. The first step was the exact position of the localized numerical values. For this, the graphic in Illustrator is using a grid has been examined. Next was the amount of data measured. That means the lowest value to the highest. The range in Ableton Live is 11 Octaves, which corresponds to 128 semitones. Per halftone implementation a number can be assigned in the y-axis. However, the graphic includes especially in the summer months, more data than in the clip view can be entered. This generally indicates that it is not it is easy to find the appropriate translation method. To explain the principle as an example, the still visible and audible numbers are sonified. It also became clear that there are no boundaries between the black data points. Therefore, the notes connected to each other in the same way so that the boundaries were no longer audible.

Conclusion
At the beginning, it is very important to interpret the data record meaningfully and to find a suitable method for translation. The more data is available, the more it is necessary to use the instruments in a meaningful way and to reduce it to the essentials. Certainly not all of Edward Tufte’s principles can be transferred to sonification, but it is on some places possible to learn from its rules and apply them. Even if the sense of sight and the sense of hearing have different facets and their own advantages, there is also something that they have in common. They want the things that people perceive to be understood as short as possible in a pleasant way. This goal applies to both visualization and sonification.